Capex Investment Post-Implementation Review Gate
For companies that approve capital projects but do not verify whether the promised savings, revenue, capacity, or efficiency benefits actually materialized. This framework creates a structured 12-, 24-, and 36-month lookback for material capex projects and evaluates performance using residual income, not ROI alone, because ROI can hide whether the project actually exceeded the cost of capital.
Download Files
Changelog
| Version | Date | Description |
|---|---|---|
| 1.0 | Apr 15, 2026 | Initial Release |
Scope / Trigger
This framework applies to capital projects above a defined materiality threshold where the original business case included specific financial benefits, such as cost savings, revenue increase, capacity expansion, productivity improvement, or efficiency gains.
Typical trigger conditions:
- The company approves capex but does not run structured post-implementation reviews.
- Original sponsors move roles, and accountability for promised benefits becomes unclear.
- ROI is used at approval, but actual post-launch performance is rarely verified.
- The capitalized asset becomes a depreciation line that is no longer traced back to the original business case.
Useful diagnostic threshold: if the company cannot isolate the actual P&L impact of any project approved in the last 36 months above its materiality threshold, this framework is relevant.
Failure Mode
The promised benefit gets absorbed into ordinary P&L movement, ownership becomes unclear, and nobody can isolate whether the project delivered what was approved.
A capex project promises $1.2 million in annual savings. Six months after go-live, volume changed, product mix changed, raw material prices moved, labor was reorganized, and FX shifted. The savings may be somewhere in the P&L, but they cannot be separated cleanly from everything else that moved at the same time.
By the time anyone looks back 18 months later, the original sponsor may have changed roles, the function owner inherited the asset, and the review becomes a vague discussion about whether the project “created value” instead of a measured comparison against the original case.
A second failure appears when companies measure performance using ROI alone. A project delivering $1.2 million of annual benefit on a $10 million asset shows a 12% ROI. That may look acceptable. But if the company’s cost of capital is 15%, the project produced negative residual income. It did not earn enough to cover the capital deployed.
Control Rule + Owner
At approval, freeze four items in writing:
- Baseline: the specific P&L lines the project is expected to affect, with current dollar values.
- Expected benefit: the expected annual benefit by year over the relevant review period.
- Asset base: total capex deployed, gross of depreciation.
- Hurdle rate: the company’s cost of capital or the rate used to approve the project.
At 12, 24, and 36 months after go-live, calculate three numbers:
- Actual benefit: the movement in affected P&L lines versus the approved baseline, adjusted for major known changes where needed.
- ROI: actual benefit ÷ gross capex deployed.
- Residual income: actual benefit − gross capex deployed × hurdle rate.
The project is judged on residual income, not ROI alone. Positive residual income means the project earned more than the cost of the capital deployed. Negative residual income means the project failed to clear the capital charge, even if the ROI percentage appears acceptable.
Owner: the current holder of the function the asset serves, not only the original sponsor. Finance owns the calculation. The function owner signs off on the operational conclusion.
The review should assess the original investment decision, not punish the current owner for inheriting the asset.
Why Residual Income — Not ROI Alone
ROI is a percentage. Residual income is dollars.
That difference matters because ROI can make smaller projects look better than larger projects even when the larger project creates more value.
Example:
- Project A: $200,000 invested, $50,000 annual benefit, 25% ROI.
- Project B: $5 million invested, $750,000 annual benefit, 15% ROI.
ROI says Project A is better. Residual income may say Project B creates more total value, depending on the hurdle rate, because the company earns dollars, not percentages.
Residual income also prevents high-performing units from rejecting good projects simply because a project would dilute their average ROI. If a business unit already runs at 20% ROI and a new project earns 16% against a 12% hurdle, the project still creates value above the cost of capital.
Worked example:
- Project A: $5 million invested, $1 million annual benefit, 15% hurdle.
- ROI = 20%.
- Residual income = $1 million − ($5 million × 15%) = +$250,000.
Project A creates value.
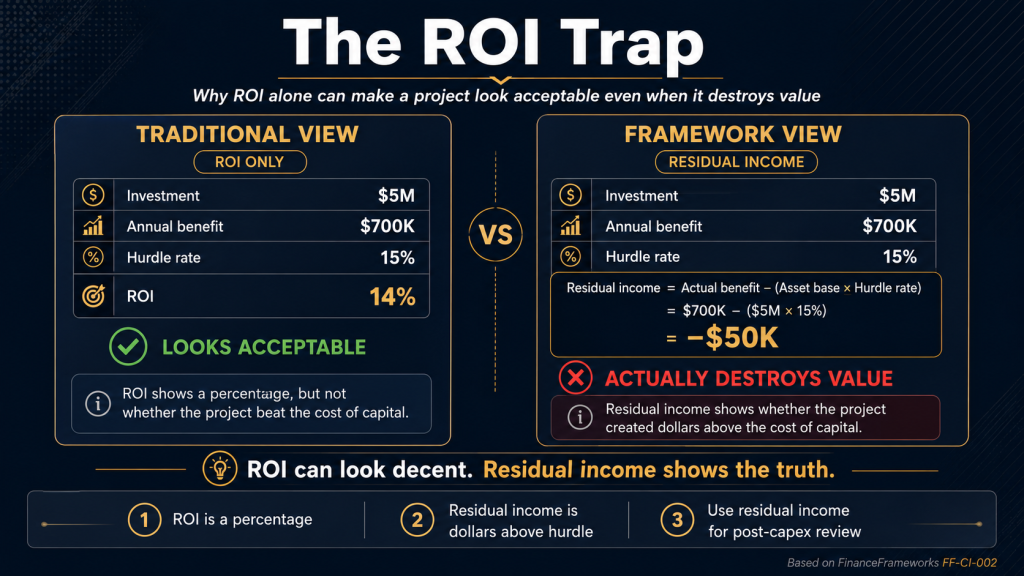
- Project B: $5 million invested, $700,000 annual benefit, 15% hurdle.
- ROI = 14%.
- Residual income = $700,000 − ($5 million × 15%) = −$50,000.
Project B destroys value even though 14% ROI may look acceptable in isolation.
Minimum Viable Implementation
-
- List every approved capex project above the materiality threshold from the last five years.
- Gather the original business case for each project, including expected benefits, asset cost, and hurdle rate.
- Pull actual results for the affected P&L lines.
- Calculate ROI and residual income for each project by year since go-live.
- Sort the portfolio by cumulative residual income, from worst to best.
- Review the bottom group first. These projects show where the company may be over-promising, under-delivering, or approving weak business cases.
- For new projects, add the 12-, 24-, and 36-month review gate directly into the approval document.
This is not designed as a punishment exercise. It is a calibration tool. If IT projects routinely deliver 65% of promised savings, or capacity projects take twice as long to produce the approved benefit, future business cases should reflect that pattern.
Impact Logic / Cost of Inaction
Without a post-implementation review, failed or underperforming projects stay buried inside depreciation, overhead, or ordinary P&L movement.
The basic test is:
Residual income = actual annual benefit − gross capex deployed × hurdle rate
Illustration:
A company invests $5 million in a project expected to generate $900,000 in annual benefit. The hurdle rate is 12%.
- Required annual return: $5 million × 12% = $600,000.
- Actual annual benefit after implementation: $450,000.
- Residual income: $450,000 − $600,000 = −$150,000.
The project may still show activity, output, or partial savings, but financially it is not earning enough to cover the capital deployed. Without a review gate, that shortfall can remain hidden for years.
Cost of this control: a spreadsheet template, two hours per project review, and one quarterly review meeting. No new software. No new headcount.
When It Stops Working
Baselines drift without adjustment.
Volume, mix, FX, raw material prices, and labor rates can all move after go-live. If the baseline is never adjusted for major external changes, the review may blame or credit the project for movements it did not cause.
Net book value is used instead of gross capex.
If residual income is calculated against net book value, old projects mechanically look better as depreciation reduces the asset base. Use original gross capex deployed for the lookback.
Strategic and compliance exemptions are abused.
Some projects are approved for regulatory, safety, compliance, or strategic reasons. Those projects may need a different review logic, but they should not automatically escape review.
The current owner feels personally blamed.
The review fails if the current function owner believes the process is judging them for an inherited decision. The policy should make clear that the review tests the original approval case and improves future decisions.
Field Notes
A $1.8 million equipment project was approved based on projected annual savings of $320,000. At the 24-month review, finance found that part of the improvement came from volume changes and staffing changes, not the project itself.
After adjusting the baseline, the recurring benefit was closer to $210,000.
With a 13% hurdle rate:
Required return: $234,000
Actual benefit: $210,000
Residual income: -$24,000
The project was useful operationally, but it did not fully clear the capital charge. The review helped improve future capex requests by forcing clearer assumptions around labor savings, volume changes, and baseline adjustments.
We tested this review approach on a warehouse automation project. The residual income calculation was useful, but it did not tell the full story.
The project did not beat the hurdle rate in the first 24 months. On paper, it looked weak. But the original reason for the investment was not only cost savings. The company needed better shipment accuracy, fewer late orders, and less dependence on temporary labor during peak months.
The lesson is that some capex projects should still go through the 12-, 24-, and 36-month review, but the approval file should separate financial benefits from strategic or risk-based benefits at the beginning.
A $3.5 million facility expansion was approved to capture an anticipated $700,000 in annual margin from new regional volume. When we ran the 12-month post-implementation review, we found that while top-line volume targets were met, the commercial team filled the new capacity with lower-margin freight to hit those volume metrics.
After isolating the actual margin contribution tied specifically to the new facility, the recurring annual benefit was only $400,000.
Operating leaders defended the project by pointing to an 11.4% ROI, which they argued was an acceptable return for a physical footprint expansion. However, applying the framework’s residual income calculation against our 15% corporate hurdle rate stripped away the operational excuses:
Gross Capex: $3,500,000
Required Return (15% hurdle): $525,000
Actual Benefit: $400,000
Residual Income: -$125,000
The project destroyed value despite hitting its utilization targets. Moving the conversation from an arguable ROI percentage to a negative residual income dollar amount shut down the debate. This review mechanism forced an immediate change in our capital allocation process: future capacity requests must now be underwritten with contractually committed volume, rather than speculative margin mix assumptions.
We installed a $6 million automated packaging line. The original business case promised $900,000 in annual labor savings, which translated to a 15% expected ROI—comfortably above our 12% corporate cost of capital.
The implementation was a mess. The machine required specialized operators we didn’t budget for, and maintenance costs spiked. Nobody ran a formal review at 12 or 24 months.
When corporate finally asked for a lookback in Year 3, the actual annual savings were only $400,000.
Instead of admitting the project underperformed, the plant leadership defended it by claiming a 13.3% ROI, arguing it was still clearing the hurdle rate. Here is exactly how they manipulated the metric: they calculated ROI using the asset’s Net Book Value (which had depreciated down to roughly $3 million) instead of the original cash outlay.
$400,000 savings ÷ $3,000,000 NBV = 13.3% ROI.
Because ROI is just a ratio, it allowed operations to hide a massive capital misallocation behind an accounting technicality.
Applying this framework’s residual income rule—which strictly mandates using Gross Capex—destroyed that illusion immediately:
-
Gross Capex: $6,000,000 / Required Return (12% hurdle): $720,000 / Actual Benefit: $400,000 Residual Income: -$320,000
The project was actively destroying $320,000 of value every year. A percentage metric gave leadership a place to hide; residual income expressed in hard dollars exposed the truth. We have since banned the use of Net Book Value and standalone ROI percentages in all post-implementation reviews.
Applied this in practice, or have experience with it?
Document what you would add.
Subscribe to updates on this framework
Get notified when this framework is updated or when new Field Notes are added.
Framework: Capex Investment Post-Implementation Review Gate
Framework ID: FF-CI-002