Activity-Based Costing as a Death-Spiral Guard
Traditional costing can make the wrong product look profitable or unprofitable. This framework uses ABC logic to show which products actually consume overhead activity. It helps prevent cross-subsidization, bad product cuts, and death-spiral decisions.
Download Files
Changelog
| Version | Date | Description |
|---|---|---|
| 1.0 | May 28, 2026 | Initial Release |
Scope / Trigger
Many manufacturers spread overhead across products with one rule — usually labor hours, machine hours, or units produced. That’s acceptable when products are similar, overhead is small, and each product uses roughly the same amount of support work. It becomes risky when products differ in complexity.
Once some products need more setups, engineering changes, inspections, purchasing events, or small-batch handling, one blanket overhead rate can quietly distort every product’s profit.
Use this framework when:
- one overhead rate covers a varied product range;
- products differ in complexity, batch size, or support needs;
- rent, admin, insurance, or other whole-company costs are baked into product margins;
- a product is being considered for discontinuation based on reported margin;
- low-volume custom products look highly profitable;
- high-volume standard products look weak;
- margins have never been checked against an activity-based view.
Rule of thumb: if overhead is large enough to change a keep/drop or pricing decision, and the products use support work differently, the blanket rate needs to be challenged.
| Question | Blanket rate | Activity-based costing |
|---|---|---|
| How overhead is split | One rule for everything | By the work each product actually uses |
| Common fixed costs | Often spread across products | Kept separate unless clearly traceable or avoidable |
| What it shows well | Direct material, direct labor, simple overhead | Support work, complexity, overhead consumption |
| What it can hide | Cross-subsidies between products | Driver errors if the activity data is weak |
| Bad-decision risk | Drop the overcharged product | Lower risk of cutting the wrong product |
| Best for | Simple, similar products | Mixed range with different complexity |
Failure Mode
The problem is not missing numbers. It’s that the numbers look clean when the allocation logic is wrong. A product-line P&L may show a precise profit or loss per product — but if overhead is assigned with one broad rate, the report may be showing allocation bias, not real product economics.
Two things usually happen.
1. One product pays another product’s bills. Total overhead doesn’t disappear — it only gets assigned somewhere. A blanket rate charges overhead by volume or hours, so a high-volume product often absorbs most of it, even when a low-volume complex product is causing the actual work: setups, engineering changes, special inspections, small runs, purchase orders, quality rework, customer-specific handling. The simple product looks worse than it is; the complex one looks better than it is. That’s cross-subsidization.
2. Whole-company costs get dumped onto products. Some costs don’t belong to one product — rent, insurance, general admin, owner salary, base facility support, property taxes. They’re real company costs, but they may not disappear if one product is dropped. Loaded into product margins, a product can show a loss it never caused. That false loss can start the death spiral.
The spiral:
- Management drops the product that looks worst.
- Its share of rent, admin, and facility support doesn’t disappear — it moves to the remaining products.
- Now the remaining products look worse.
- Management cuts again.
- The fixed-cost burden spreads over a smaller base.
- Each cut makes the next cut look more justified.
The allocation method starts picking the loser — instead of the economics of the business.
Control Rule + Owner
Before dropping, repricing, or deprioritizing a product line, compare the blanket-rate margin against an activity-based margin. Do not make a keep/drop decision from the blanket-rate report alone when products differ in complexity.
Owner: the controller, cost accountant, FP&A lead, or whoever produces the product-line P&L.
The control: for any material product-line decision, the profitability review must show:
- current blanket-rate margin;
- activity-based margin;
- the activity cost pools and drivers used;
- activity volume by product;
- common fixed costs shown separately;
- whether the cost would actually disappear if the product were dropped.
Red flags — stop and review before deciding if:
- a product shows profit under one method and loss under the other;
- the product ranking changes between the two methods;
- a low-volume product consumes a large share of setups, inspections, or engineering jobs;
- a high-volume product looks weak even though it uses little support work;
- a product was dropped recently and the remaining products became less profitable afterward.
The one signal to watch: whether the activity-based view changes the decision. If both methods point to the same decision, risk is lower. If the activity-based view flips the answer, stop and investigate before cutting, repricing, or deprioritizing the product.
Exceptions:
- A whole-company cost can be charged to one product only if it’s clearly traceable or avoidable.
- If tax, inventory, or external reporting needs all-in product costing, keep that version separately — don’t use it alone for keep/drop decisions.
- Owner override is allowed, but write down the reason. One sentence is enough: “Decision approved based on activity-based margin review, not blanket-rate margin alone.”
Minimum Viable Implementation
- Pull the current product-line P&L using the existing blanket-rate method.
- Split overhead into two buckets: activity-driven costs and common fixed costs.
- Keep common fixed costs separate unless they’re clearly traceable or avoidable.
- Group activity-driven overhead into a few simple cost pools (see below).
- Calculate each activity rate: activity cost pool ÷ total activity volume = activity rate.
- Charge each product by the work it uses: activity rate × product activity usage = assigned cost.
- Rebuild the product-line P&L.
- Compare the blanket-rate view against the activity-based view.
- Flag any product that changes profit-to-loss, loss-to-profit, or materially changes rank.
- Repeat before major pricing, product-mix, or keep/drop decisions.
This is a monitoring control, not a one-time costing exercise.
| Activity cost pool | Driver |
|---|---|
| Machine support | Machine hours |
| Setups | Number of setups |
| Quality control | Inspections |
| Engineering support | Engineering jobs |
| Purchasing | Purchase orders |
Impact Logic / Cost of Inaction
The cost isn’t only bad reporting. The real cost is making a permanent decision from a distorted report — cutting the product that’s actually carrying the business and protecting the product consuming the hidden support work.
Worked Example — Verline Pumps. Two products, Standard and Custom. Last month.
| Standard | Custom | Total | |
|---|---|---|---|
| Units sold | 3,000 | 600 | |
| Price each | $95 | $260 | |
| Materials each | $18 | $44 | |
| Labor rate | $25/hr | $25/hr | |
| Labor hours each | 2 | 4 | |
| Total overhead | $252,000 |
Step 1 — Blanket rate. Total labor hours = (3,000 × 2) + (600 × 4) = 8,400. Blanket rate = $252,000 ÷ 8,400 = $30 per labor hour.
| Standard | Custom | Total | |
|---|---|---|---|
| Sales | $285,000 | $156,000 | $441,000 |
| Materials | ($54,000) | ($26,400) | ($80,400) |
| Labor | ($150,000) | ($60,000) | ($210,000) |
| Overhead @ $30/hr | ($180,000) | ($72,000) | ($252,000) |
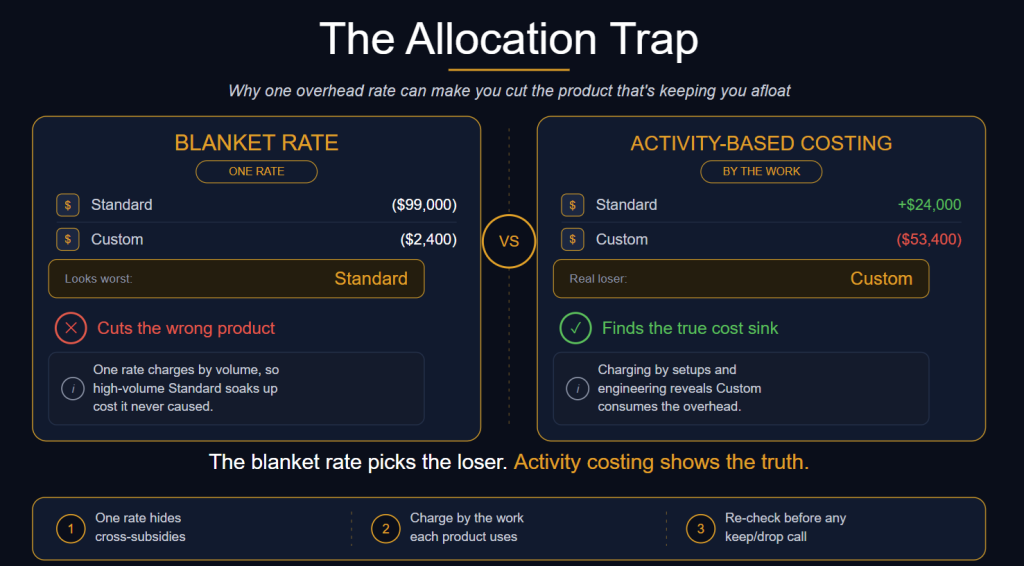
| Product profit | ($99,000) | ($2,400) | ($101,400) |
Under the blanket rate, Standard looks like the disaster. A manager could say “drop Standard, it lost $99,000.” That would be premature.
Step 2 — Separate common fixed costs. Of the $252,000, $72,000 is rent and general admin. That cost doesn’t disappear if Standard is dropped, so it’s shown separately. Activity-driven overhead = $252,000 − $72,000 = $180,000.
Step 3 — Charge activity costs by actual work.
| Activity | Cost | Driver | Standard | Custom | Total |
|---|---|---|---|---|---|
| Machine support | $36,000 | Machine hours | 6,000 | 1,200 | 7,200 |
| Setups | $90,000 | Number of setups | 12 | 48 | 60 |
| Engineering | $54,000 | Engineering jobs | 5 | 25 | 30 |
Activity rates: machine support $36,000 ÷ 7,200 = $5/machine hour · setups $90,000 ÷ 60 = $1,500/setup · engineering $54,000 ÷ 30 = $1,800/job.
Step 4 — Activity-based margin.
| Standard | Custom | Total | |
|---|---|---|---|
| Sales | $285,000 | $156,000 | $441,000 |
| Materials | ($54,000) | ($26,400) | ($80,400) |
| Labor | ($150,000) | ($60,000) | ($210,000) |
| Machine support | ($30,000) | ($6,000) | ($36,000) |
| Setups | ($18,000) | ($72,000) | ($90,000) |
| Engineering | ($9,000) | ($45,000) | ($54,000) |
| Product profit before common fixed costs | $24,000 | ($53,400) | ($29,400) |
| Rent and admin | ($72,000) | ||
| Company profit | ($101,400) |
The company total didn’t change — it can’t. The signal changed completely. The blanket rate said Standard was the problem. The activity view shows the opposite: Standard contributes +$24,000, while Custom loses $53,400 — consuming 48 of 60 setups and 25 of 30 engineering jobs on a fifth of the volume. Standard’s volume was quietly paying for Custom’s complexity.
Step 5 — What the bad decision costs. Suppose management trusts the blanket report and drops Standard. Standard’s +$24,000 contribution disappears. Custom’s activity costs are driven by Custom’s own work, so they stay. Rent and admin stay. The company is now:
| Amount | |
|---|---|
| Custom sales | $156,000 |
| Custom materials, labor, activity costs | ($209,400) |
| Custom result before common fixed costs | ($53,400) |
| Rent and admin (still there) | ($72,000) |
| Company result after dropping Standard | ($125,400) |
Dropping the “loser” made the company $24,000 worse — from a $101,400 loss to a $125,400 loss. That’s the death spiral’s first step: the blanket rate named the wrong product, the cut removed real contribution, and the fixed costs simply landed on Custom. The next instinct would be to look at Custom’s now-uglier numbers and cut again.
The better move was never “drop Standard.” It was to act on what the activity view revealed about Custom: challenge Custom pricing, reduce setups, charge engineering separately, raise the minimum order size, or redesign the custom process — and review whether Standard’s pricing or volume can grow.
ABC doesn’t magically create profit. It shows where the cost is actually coming from before management cuts the wrong thing.
Cost of inaction. Without this check, management may drop the product that isn’t the real problem, protect the one consuming the support work, underprice complex custom jobs, overprice simple high-volume work, and shift fixed costs onto a shrinking base — starting a death spiral. The cost of inaction isn’t bad math. It’s a bad decision made with confidence.
When It Stops Working
Activity-based costing isn’t always worth the effort. It breaks down when:
- The business is too simple. Similar products, small overhead, roughly equal support work → the blanket rate may be good enough. Don’t build a complex model to solve a small distortion.
- The activity data isn’t available. ABC needs real counts — setups, inspections, engineering jobs, purchase orders, machine hours. No tracked work → the model becomes guesswork. A rough model is fine; a fake-precise one isn’t.
- The model becomes too complex. The first version shouldn’t have 25 cost pools. Start with the few activities that explain most of the distortion (machine support, setups, quality, engineering, purchasing).
- The savings are slower than they look. ABC may show a product eating too much support work — but you can’t fire a third of a machine or remove rent overnight. Use it to guide decisions, not to promise instant cash.
- Common fixed costs get treated as avoidable. The biggest trap. Rent, insurance, owner salary, facility support and admin usually remain after a product is dropped. If they stay, don’t count them as savings from the cut.
- External reporting gets confused with internal decisions. ABC is mainly an internal decision tool. Tax, inventory, and external reporting may require a different method. Keep both; use the right one for the right purpose.
- Management ignores the activity view. If the controller builds it but the owner still decides from the old report, the control does nothing. The activity review must be part of the decision package.
- The model isn’t refreshed. It drifts when product mix, batch sizes, engineering or inspection work, setup counts, or customer behavior change. Refresh quarterly for active lines, or before any major keep/drop decision.
Field Notes
No field notes yet for this framework.
Applied this in practice, or have experience with it?
Document what you would add.
Subscribe to updates on this framework
Get notified when this framework is updated or when new Field Notes are added.
Framework: Activity-Based Costing as a Death-Spiral Guard
Framework ID: FF-PM-002